Data & methodology
Where every number on fruitycanyon actually comes from: the Cotality Daily Home Price Index behind the Australian Home Prices dashboard, and the Property Map's Data SA suburb data behind the Property Map. Full provenance, transformations, field-by-field glossaries, and known limitations for both — nothing trimmed, only explained.
Cotality Daily Home Price Index
- Source
- Cotality (a property data and analytics provider). The figures reach FruityCanyon indirectly: Cotality's Daily Home Value Index is shared publicly on X (Twitter) by @rabbit_wealth (“rabbittail”), and Luca Burford manually transcribes the numbers from those posts. FruityCanyon has no affiliation with, endorsement from, or licence from Cotality or @rabbit_wealth. This is an independent, personal project.
- Dataset / product
- Cotality Daily Home Value Index
- Coverage
- Sydney, Melbourne, Brisbane, Adelaide, Perth, plus a 5-capital aggregate
- Observation frequency
- Daily
- Collection method
- Manually transcribed by hand from four tables shared as screenshots on X (Twitter) by @rabbit_wealth each day (Price Changes %, Market Metrics, Index levels, Price Changes per $1M). Not an automated feed, and not Luca's own direct Cotality subscription. See “What Cotality publishes vs. what FruityCanyon calculates” below.
- Date range
- loading…
- Last updated
- loading…
- Collected & transcribed by
- Luca Burford
- Status
- Independently transcribed for personal analysis, not an official Cotality publication. Transcription is manual, so occasional entry errors are possible. See Limitations below.
Where this data comes from
A fixed example, added 10 Sep 2026, using a set of screenshots from 1 Aug 2026, showing exactly what @rabbit_wealth's four source tables look like and which fields they become in FruityCanyon's data. This isn't a live feed and won't change day to day. It's here once, to make the source chain concrete rather than just described in prose.
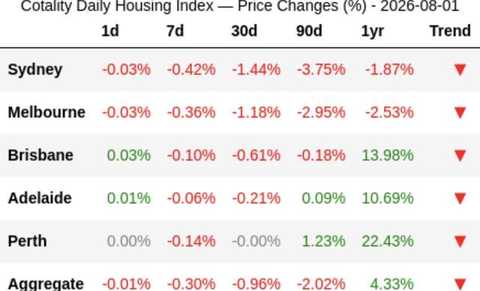
pct_1d, pct_7d, pct_30d and pct_90d.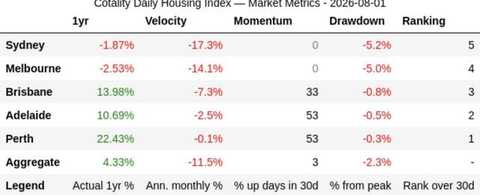
velocity_ann_monthly_pct, momentum_up_days_pct_30d, drawdown_from_peak_pct and rank_30d; the 1yr column here becomes pct_1yr.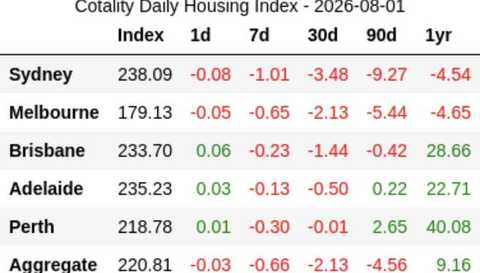
index.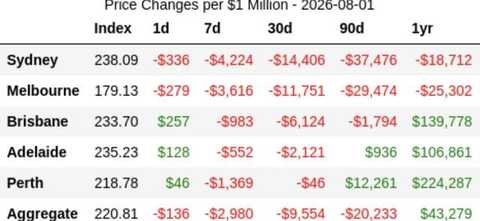
dollar_per_1m_1d through dollar_per_1m_1yr.How to read this dashboard
- 30-day pace / annualised momentum
- How fast a city's prices have moved over the last 30 days, expressed as an annual rate. This is Cotality's own published figure, transcribed as-is. It is not a FruityCanyon forecast, prediction, or expected annual growth figure. Short-term rates like this can be volatile and are not a reliable guide to what the next 12 months will actually do.
- 1-year change
- Cotality's own official trailing 12-month figure for that city.
- Momentum / rank / drawdown
- All Cotality's own published Market Metrics figures, transcribed as-is.
- $ impact figures
- Most dollar figures on the dashboard (the “$1M home” chart) are also Cotality's own published Price-Changes-per-$1M figures. One exception is flagged below.
- “$ toll since the peak” chart
- This one is a FruityCanyon calculation (see the formula below), and is marked with a “Calculated by FruityCanyon” badge on the chart itself.
- Not a forecast
- Every figure on this page and the dashboard describes what has already happened. Nothing here predicts, forecasts, or guarantees future prices.
What Cotality publishes vs. what FruityCanyon calculates
Almost everything on this dashboard is a number Cotality itself computes and displays. FruityCanyon copies it by hand from a screenshot. The one calculation FruityCanyon actually performs is turning a drawdown percentage into a dollar figure.
Cotality compiles the index. @rabbit_wealth posts screenshots of it on X (Twitter). Luca Burford manually transcribes the numbers from those posts into this site's dataset. FruityCanyon does not have a direct Cotality subscription or feed.
Sourced directly from Cotality, transcribed and not calculated by FruityCanyon: index level, 1-day / 7-day / 30-day / 90-day % change, 1-year % change, the annualised 30-day pace (“velocity”), the momentum score, the 30-day rank, the drawdown-from-peak %, and the $-per-$1M change figures. These all come from Cotality's own Market Metrics and Price-Changes tables. FruityCanyon does not compute, annualise, or otherwise derive any of them.
Calculated by FruityCanyon: the “$ toll since the peak” chart only.
Simple explanation
We take Cotality's own “how far below peak” percentage for a city and scale it to what that would mean in dollars, for a hypothetical $1,000,000 home.
Technical formula
dollar_toll_since_peak = drawdown_from_peak_pct × ($1,000,000 ÷ 100)
                       = drawdown_from_peak_pct × $10,000
Example: a drawdown of −7.2% becomes −7.2 × $10,000 = −$72,000. drawdown_from_peak_pct itself is Cotality's own published figure; only the dollar conversion is FruityCanyon's.
Field glossary
Full field-by-field definitions for both datasets on this site — every column in the Cotality Daily Home Price Index above and the Property Map's suburb dataset below, one by one — are kept as a downloadable PDF rather than an on-page table, to keep this page shorter: Download the field glossary (PDF).
Download the data
Every capital, every captured day, plus Luca's daily written note, as a CSV: download australian-home-prices.csv. Regenerated from this page's own data at request time, so it's always current as new days are added — this is now the full day-by-day record; nothing is browsable on this page itself any more. It covers the columns described in the field glossary above (index, velocity, momentum, drawdown, 1-year %, the 30-day $ toll, rank, and the daily note), not the extra columns in Luca's private working spreadsheet (per-horizon dollar figures beyond 30 days, and a reserved column that's never been populated).
Limitations
- FruityCanyon is an independent, personal analysis project and should not be treated as an official Cotality publication, endorsed by Cotality, or a substitute for Cotality's own reporting.
- This data passes through two manual steps before it reaches this site: @rabbit_wealth's own capture of Cotality's index (a process FruityCanyon has no visibility into), then Luca Burford's transcription of those posts into this dataset. Manual transcription at either step can introduce errors, even with cross-checks in place.
- Short-term annualised figures (like the 30-day pace) can swing sharply on limited data and should not be read as a prediction of the next 12 months.
- Nothing on this site is financial advice. It describes recent, historical market movement; it does not account for future interest rates, supply, demand, policy changes, or other factors that influence property prices.
- Some days are missing from the dataset (see the CSV download above for the full day-by-day record). Gaps are left as gaps, not estimated or filled in.
Property Map — Suburb Median House Prices
Data behind the interactive suburb map.
- Source
- Data SA, South Australian Government quarterly median house price releases.
- Original measure
- Median house sale price, sales volume, and year-on-year growth, for the quarter, per suburb.
- Geography
- Suburb (as grouped by local government area in the source files)
- Observation frequency
- Quarterly
- Date range
- 2014 Q1 – 2026 Q2 (as of 11 Sep 2026)
- Collection method
- Downloaded directly from Data SA's published quarterly spreadsheets and imported programmatically — not manually transcribed (unlike the Cotality dataset above).
- FruityCanyon transformation
- Growth is converted from the source file's decimal fraction to a percentage. Suburbs listed under more than one council area in the source are de-duplicated. Quarters with zero recorded sales carry forward the suburb's last known median price rather than showing a gap.
- Status
- Independent, personal project. Not an official Data SA publication, and not financial or property advice.
Property Map — source data & licensing
Every figure traces back to the Government of South Australia's own quarterly release, Metro median house sales (Data.SA), published under a Creative Commons Attribution 4.0 licence, which permits redistributing the raw files with attribution.
Attribution: Government of South Australia, Data.SA, “Metro median house sales,” sourced 9 Sep 2026, https://data.sa.gov.au/data/dataset/metro-median-house-sales. FruityCanyon does not currently mirror the individual quarterly xlsx files on this site — the link above goes to Data SA's own dataset page, where every quarter's file is published directly by the source.
Property Map — a worked example
Aldgate, 2022-Q3: Data SA's own file records a “Median Change” of 0.405714… for that suburb and quarter. FruityCanyon multiplies by 100 and displays 40.6%. Nothing else changes: median price ($1,230,000) and sales volume (17) are shown exactly as published.
Ashton, 2022-Q3: zero recorded sales that quarter. Rather than show a gap, FruityCanyon carries forward Ashton's last known median price ($765,000) so the table always has a value to display.
Property Map — known issues
- Blank growth stored as 0%, not left blank. When there isn't enough sales data to compute a year-on-year comparison, Data SA's own file leaves “Median Change” blank, correctly so, since no figure can be computed. FruityCanyon's live data currently stores and serves that blank as a literal 0%, which reads as “no change” rather than “not computable.” Example: Glenelg, 2022-Q3 shows 0% growth because the prior quarter had no sales to compare against, not because the market was genuinely flat. A code fix was written 8 Sep 2026 but hasn't been deployed or backfilled yet. Until then, treat a 0% growth figure alongside a very low sales volume as possibly this issue rather than a genuinely flat market.
- The source data is houses only, and year-on-year change only. That's a property of the government release, not a limitation introduced by this site.